Final proof that support sells.
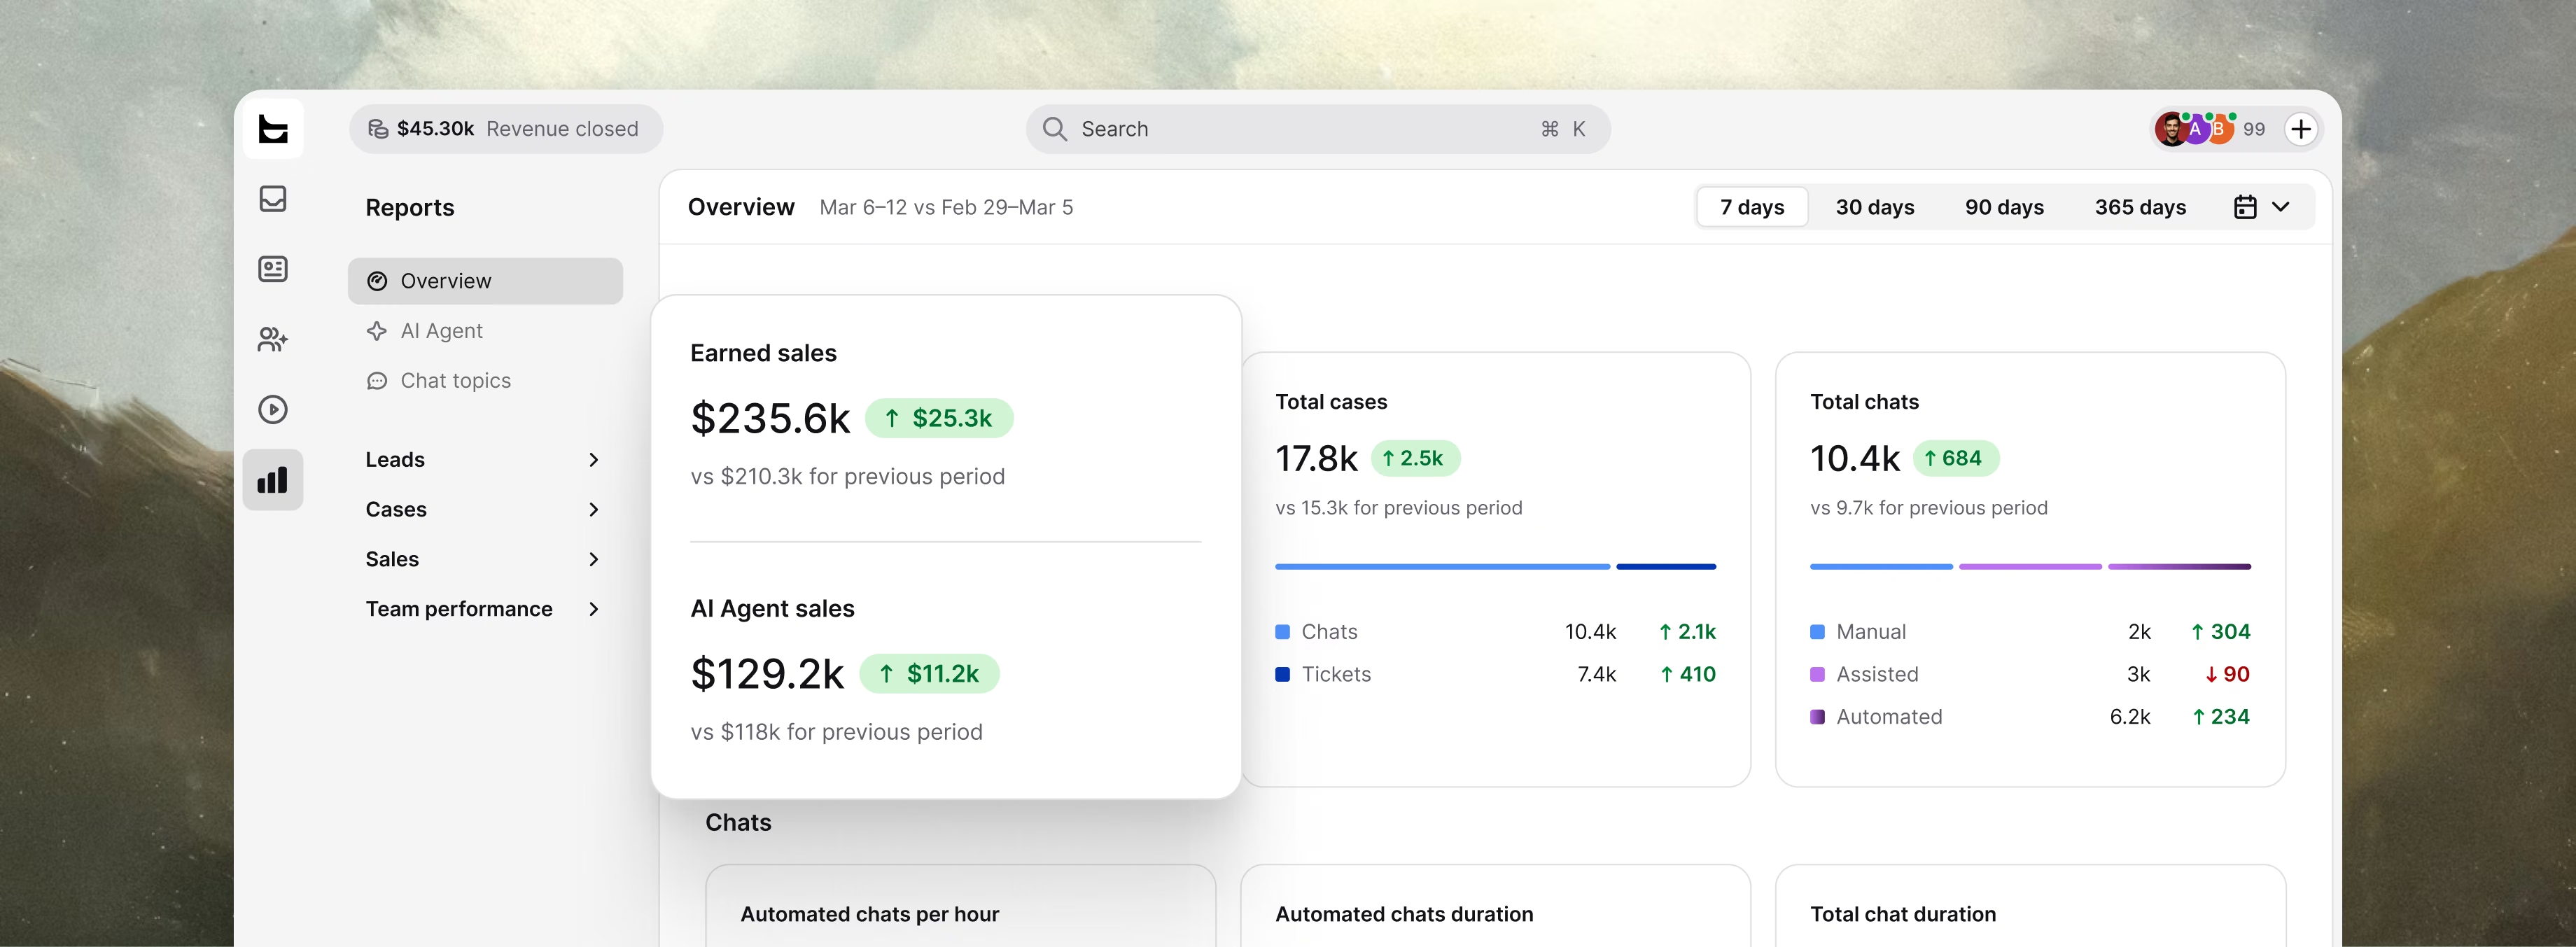
See what your support earns, not just what it costs. Analytics built around the sales it closes, the leads it captures, and the cases it handles — all in one view.
30,000+ teams already turning conversations into revenue








































Measure revenue, not just tickets.
Every chat, ticket, and AI interaction — tied to the revenue it drives. See what pays off. Fix what doesn't.
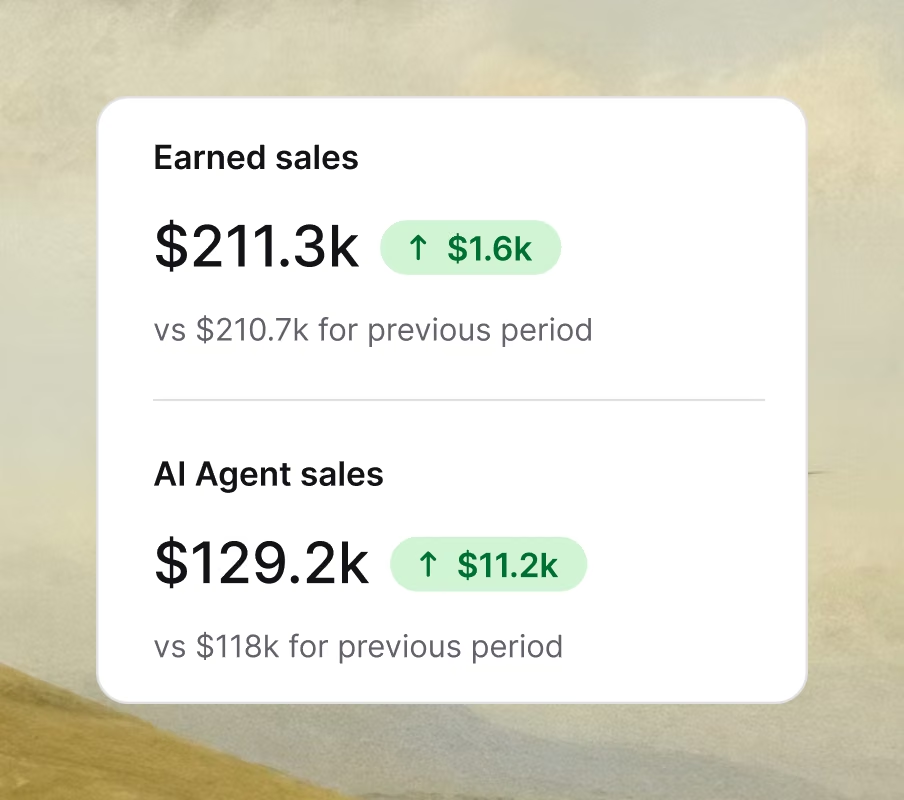
Revenue, not just resolutions
Revenue generated from chats. Revenue at stake right now. Average revenue per conversation. Customer analytics built around what your support earns — not just how fast it answers.
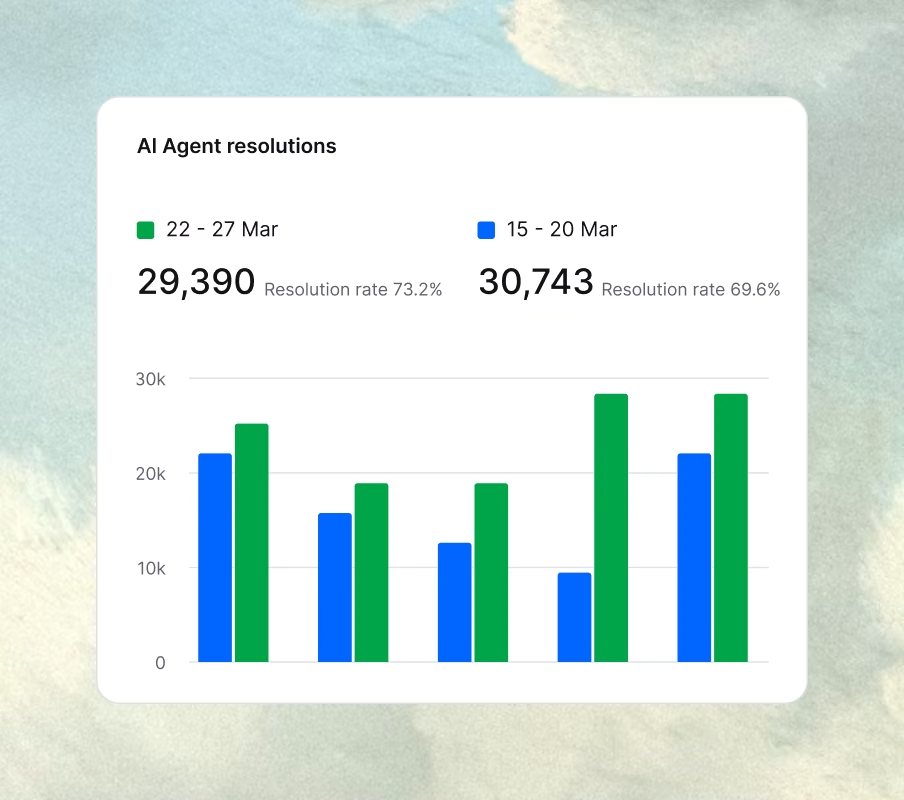
AI performance. Measured in money
AI resolution rate, AI Agent CSAT, transferred chats, and revenue from AI-only conversations. See where your AI earns its keep, and where it comes from.
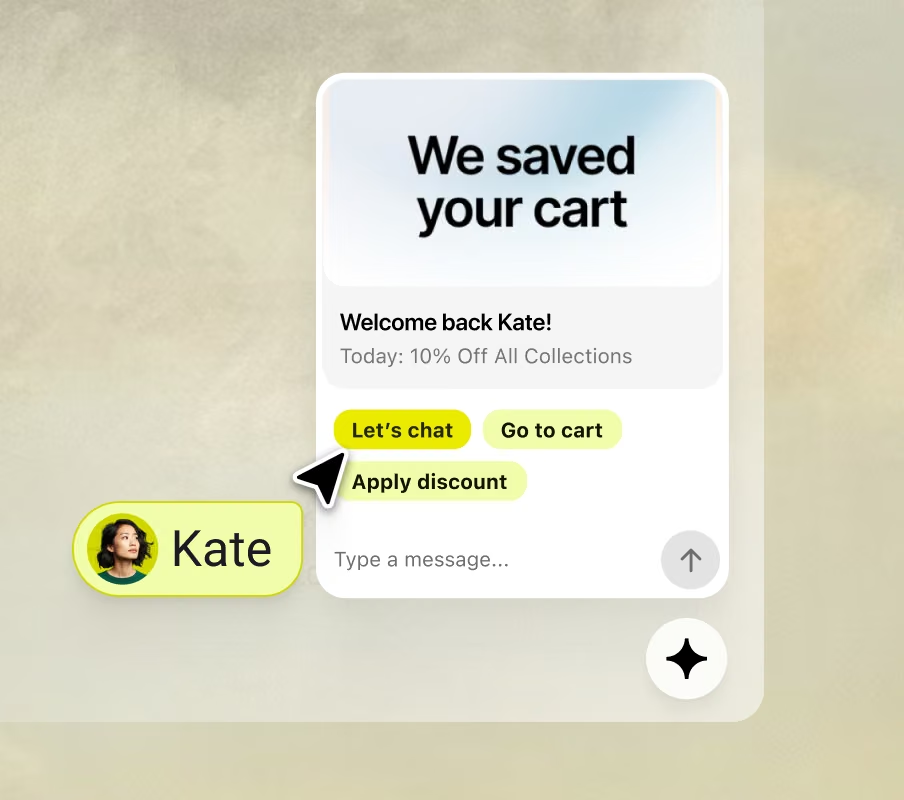
Catch the sale before it walks
Real-time cards spot visitors comparing products or with an abandoned cart, showing what it's worth. Launch a campaign, and AI Agent takes it from there.
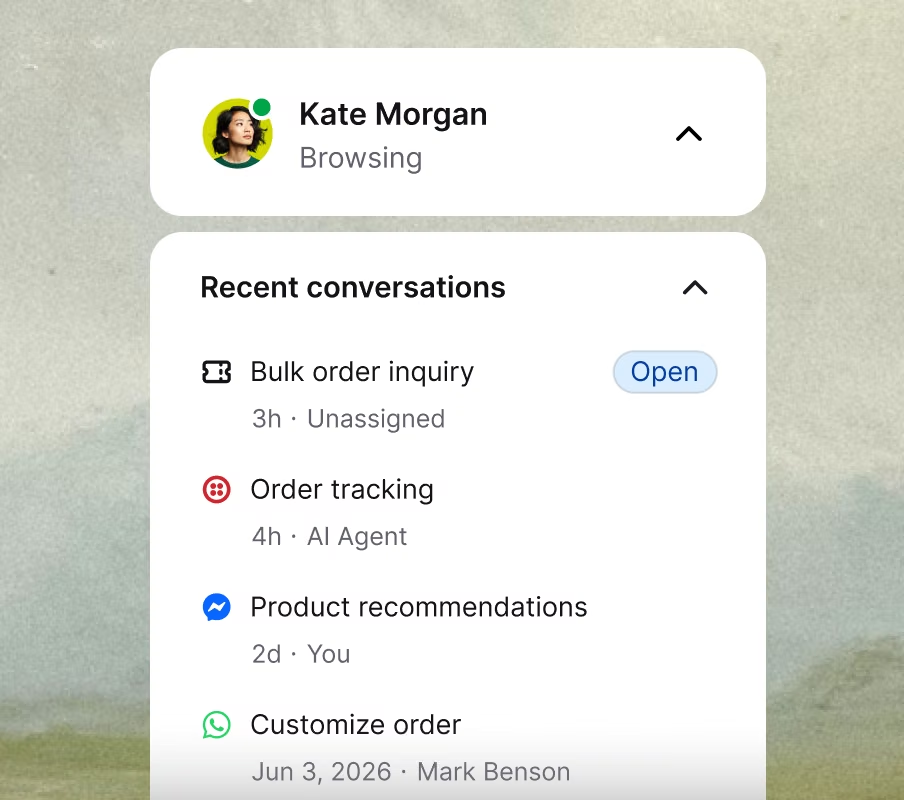
One customer. Not four tickets
Chat, Messenger, SMS, and email lead to the same buyer. Text merges every conversation into one profile. Now cost-per-ticket finally tells you what serving a customer really costs.
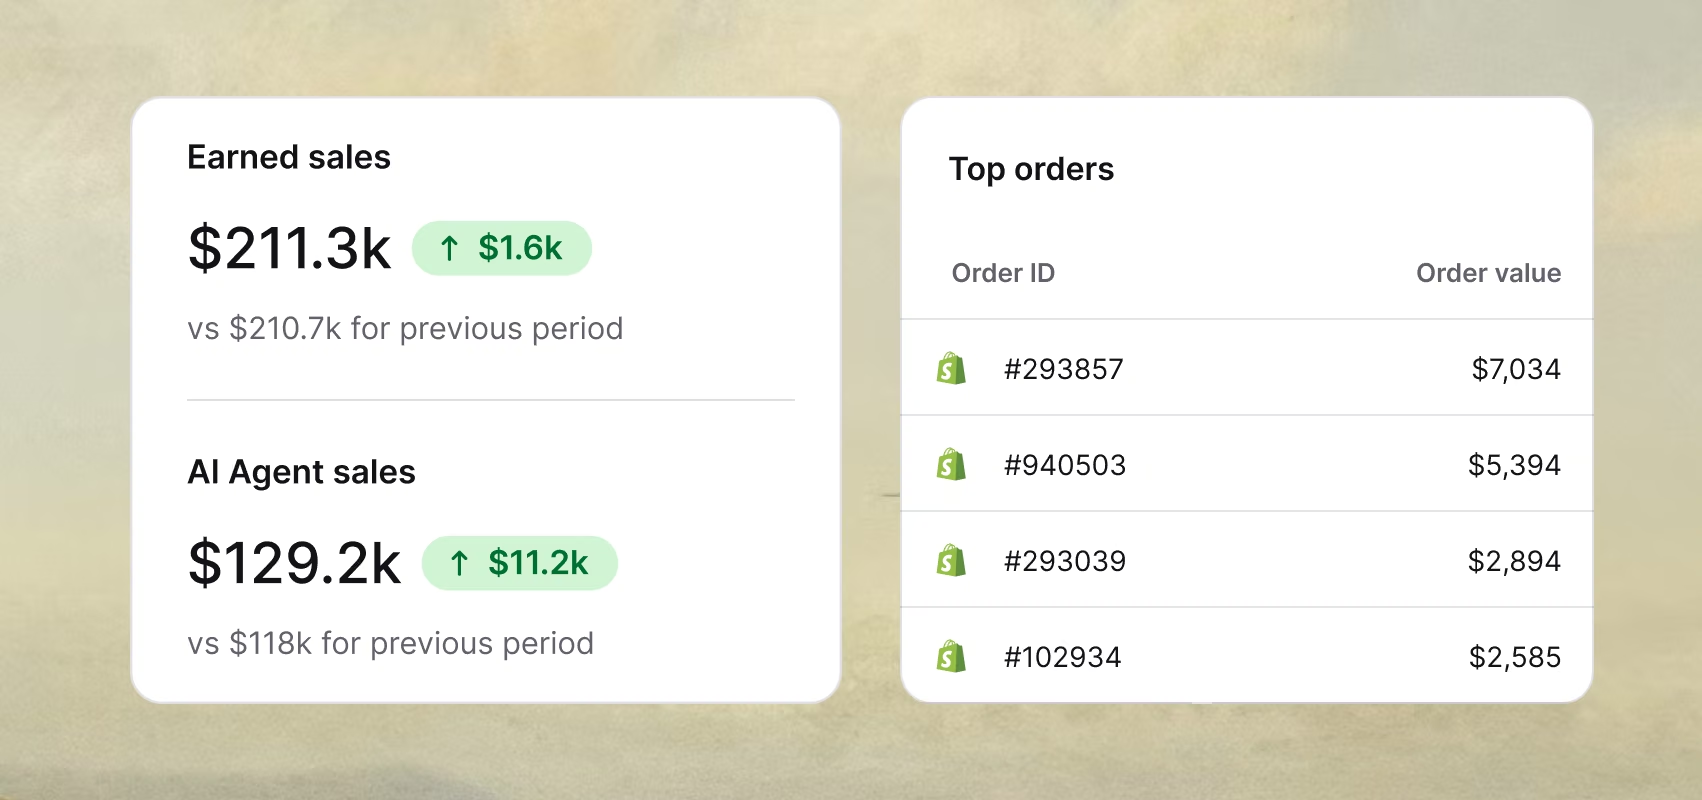
Revenue, not just resolutions
Revenue generated from chats. Revenue at stake right now. Average revenue per conversation. Customer analytics built around what your support earns — not just how fast it answers.
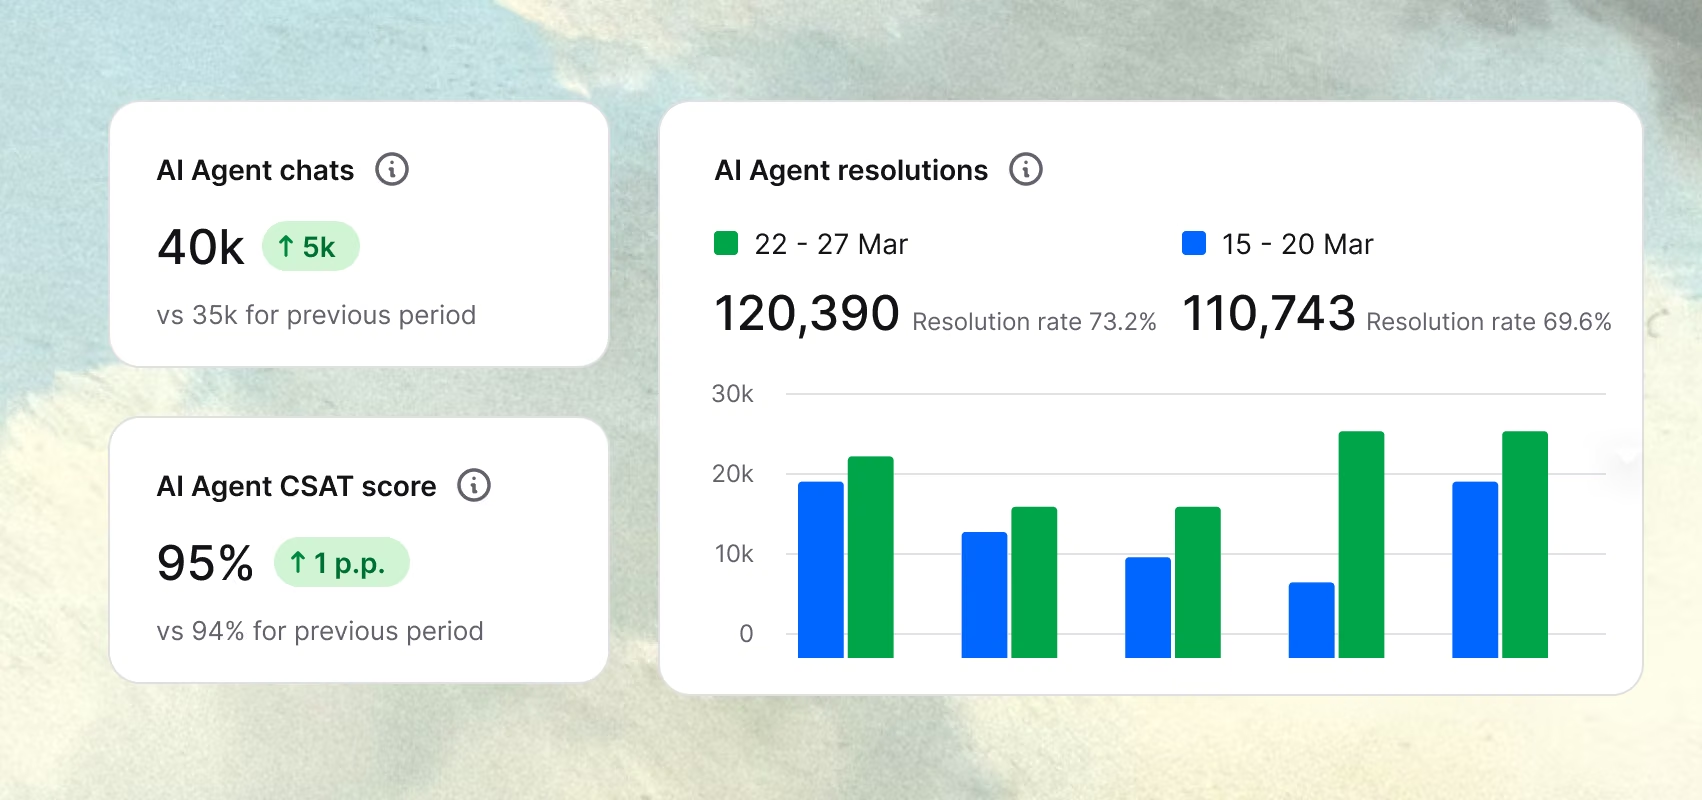
AI performance. Measured in money
AI resolution rate, AI Agent CSAT, transferred chats, and revenue from AI-only conversations. See where your AI earns its keep, and where it comes from.
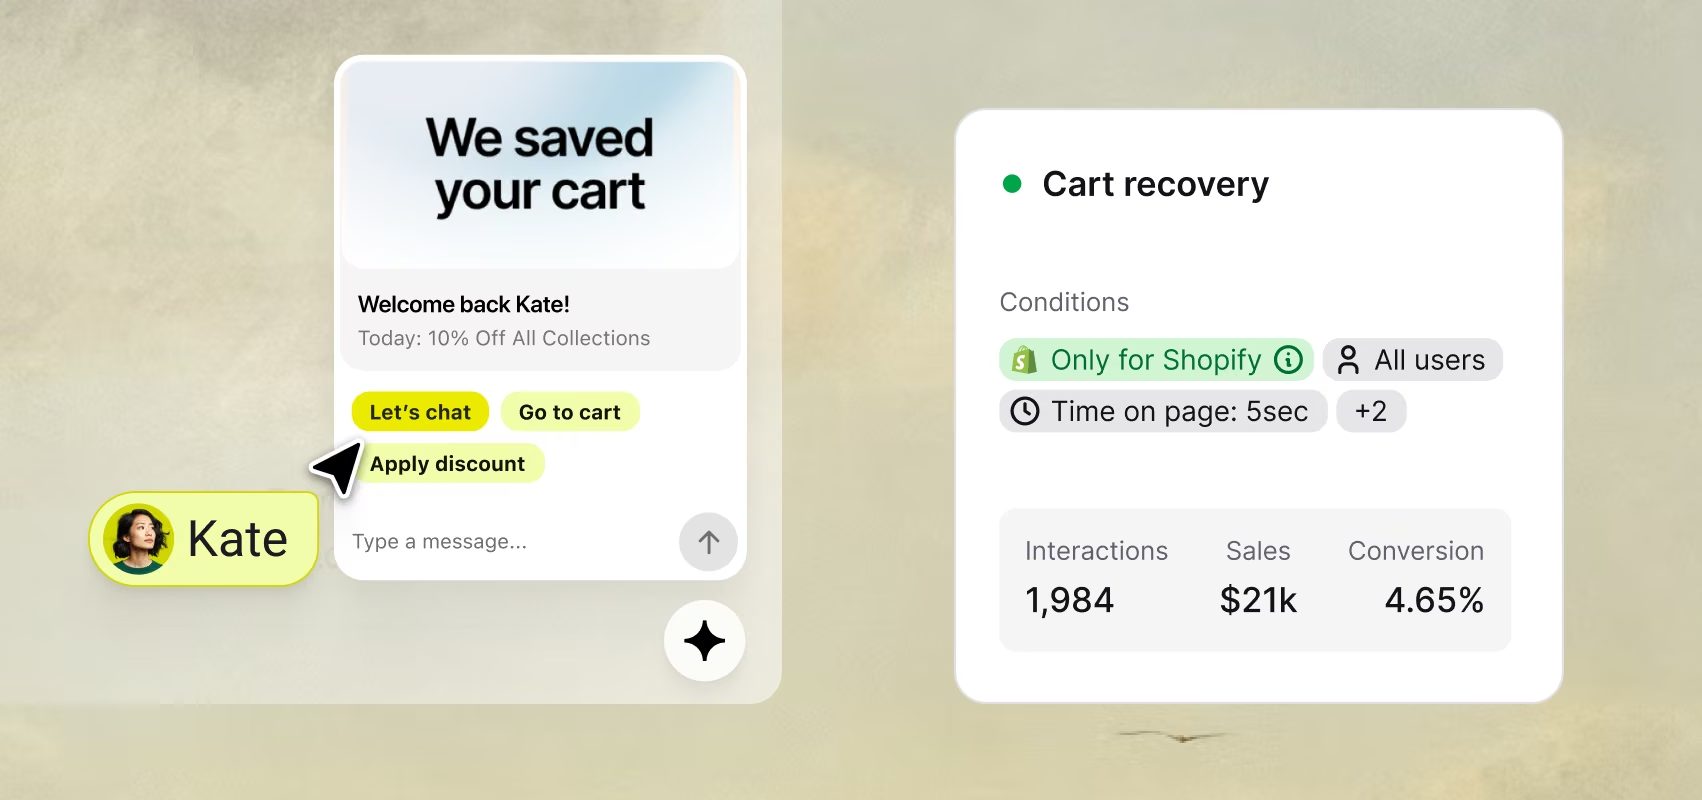
Catch the sale before it walks
Real-time cards spot visitors comparing products or with an abandoned cart, showing what it's worth. Launch a campaign, and AI Agent takes it from there.
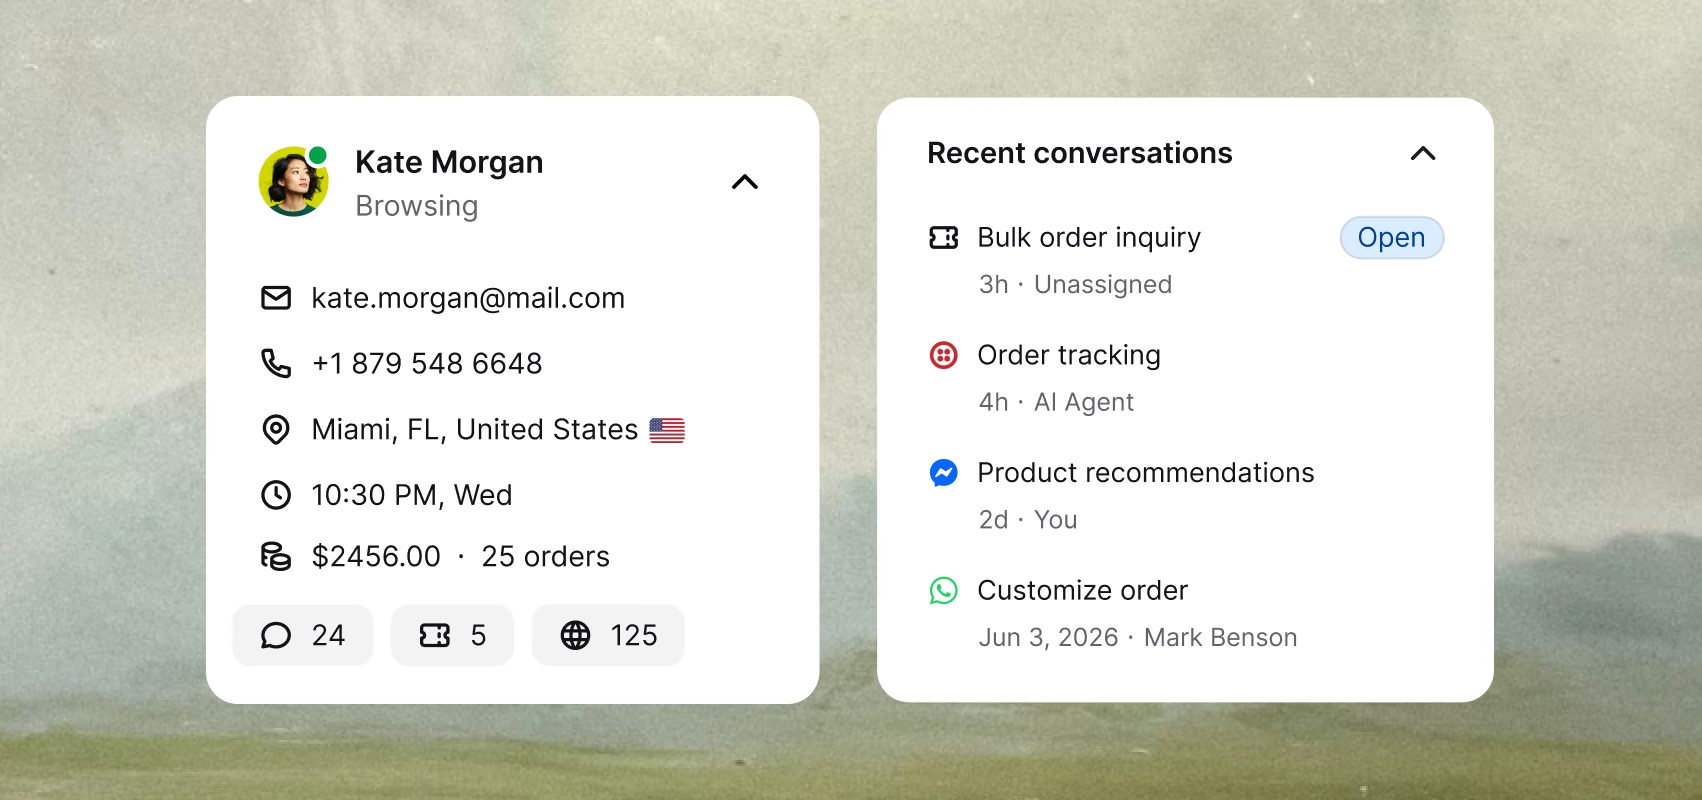
One customer. Not four tickets
Chat, Messenger, SMS, and email lead to the same buyer. Text merges every conversation into one profile. Now cost-per-ticket finally tells you what serving a customer really costs.

Reports are easy to access, so we can see what's going well and what needs a little work.
432%
growth in AI Agent sales
70%
of all chat sales driven through AI Agent
98%
AI Agent resolution rate
All your customer support analytics. One screen.
Live data, weekly trends, AI-flagged changes. Everything you need to make today's sales and support calls.
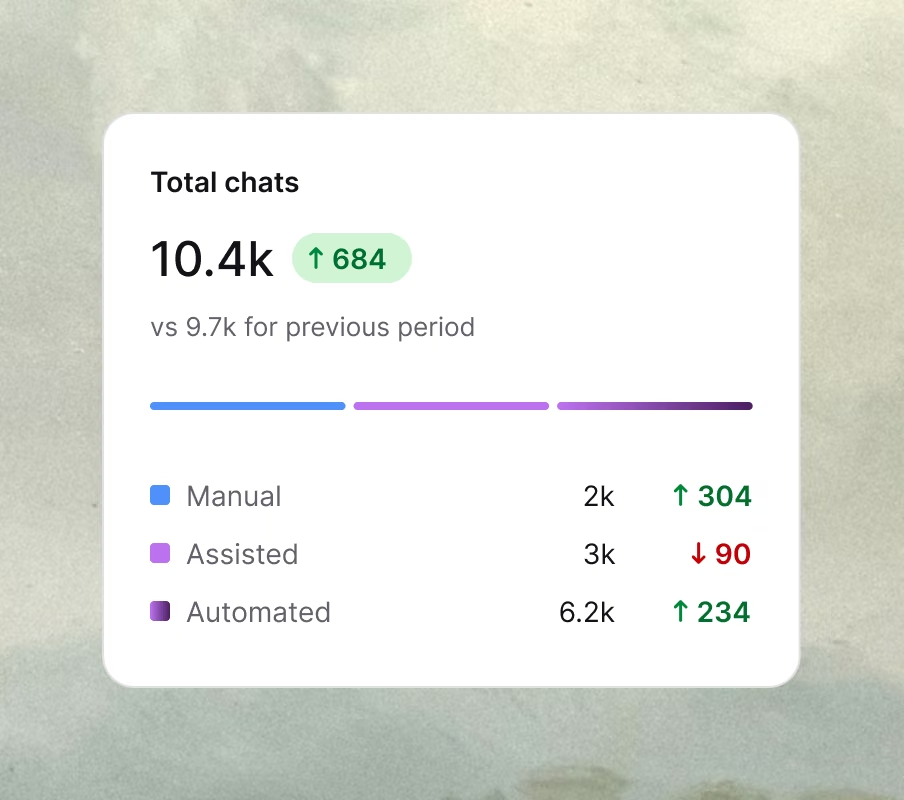
Live signals. Long-term trends
Chat volume, CSAT, and response time, tracked live and over weeks. See a dip the moment it happens, or a trend that's been building since Tuesday.
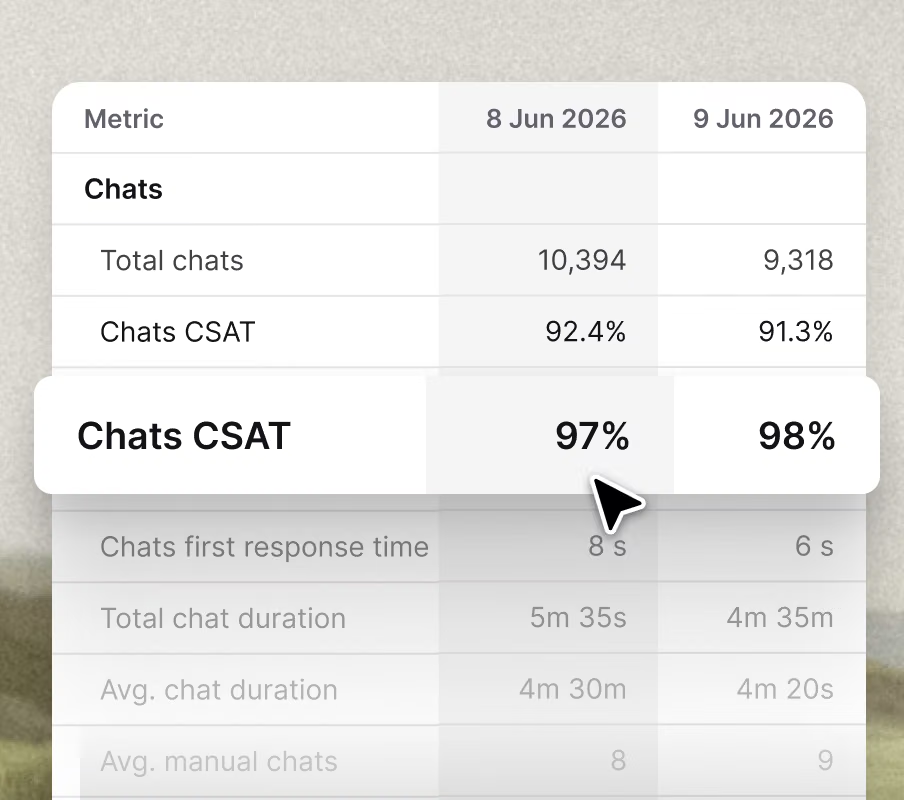
Reports that speak business
One click turns chats and tickets into a clear picture: what's working, where response times lag, and where revenue is slipping away.
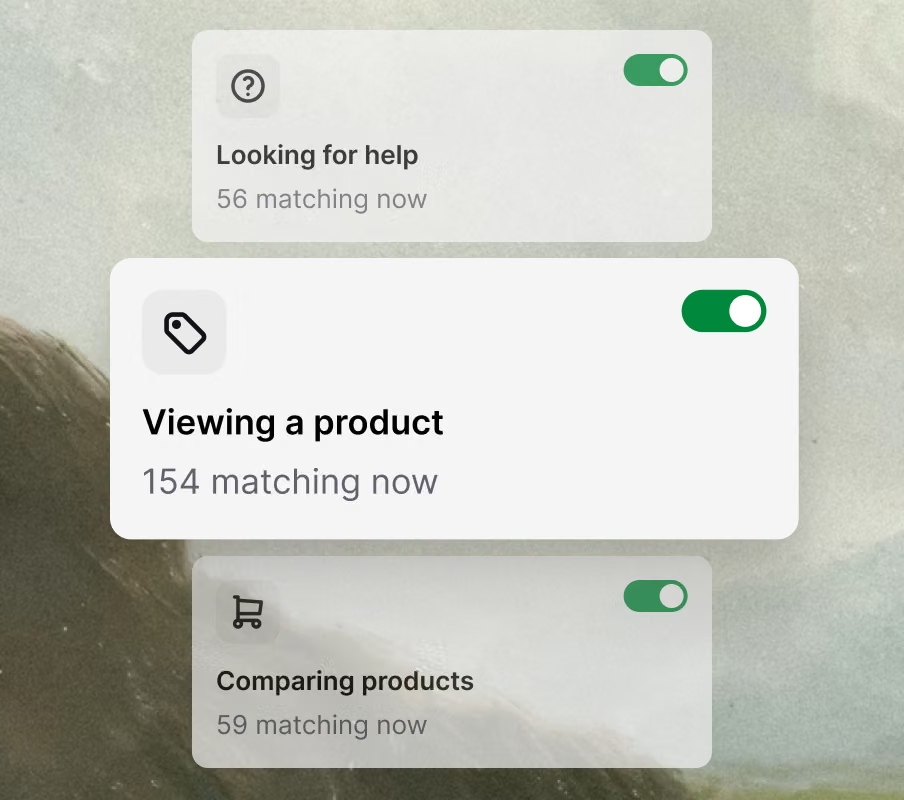
Buyers, spotted early
Every visitor sorted by intent, from casual browsing to comparing prices to closing in on checkout. Step in the moment it actually counts.
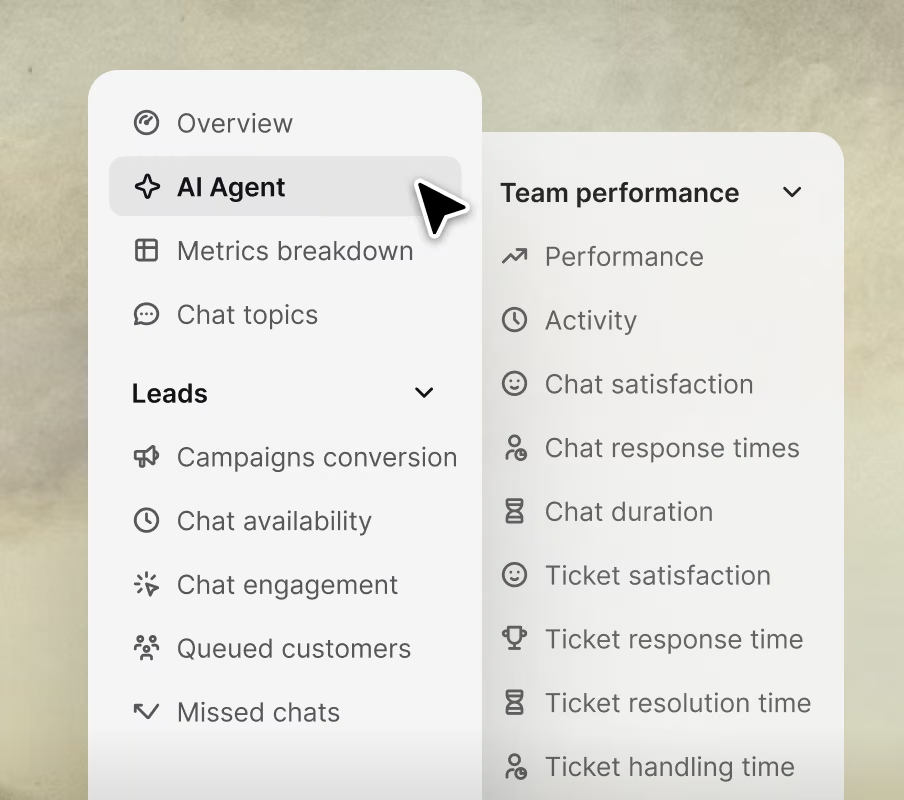
Built-in analytics, no extra tools
No separate dashboards, no third-party tools to configure and maintain. Everything ships ready to use, right inside the platform.
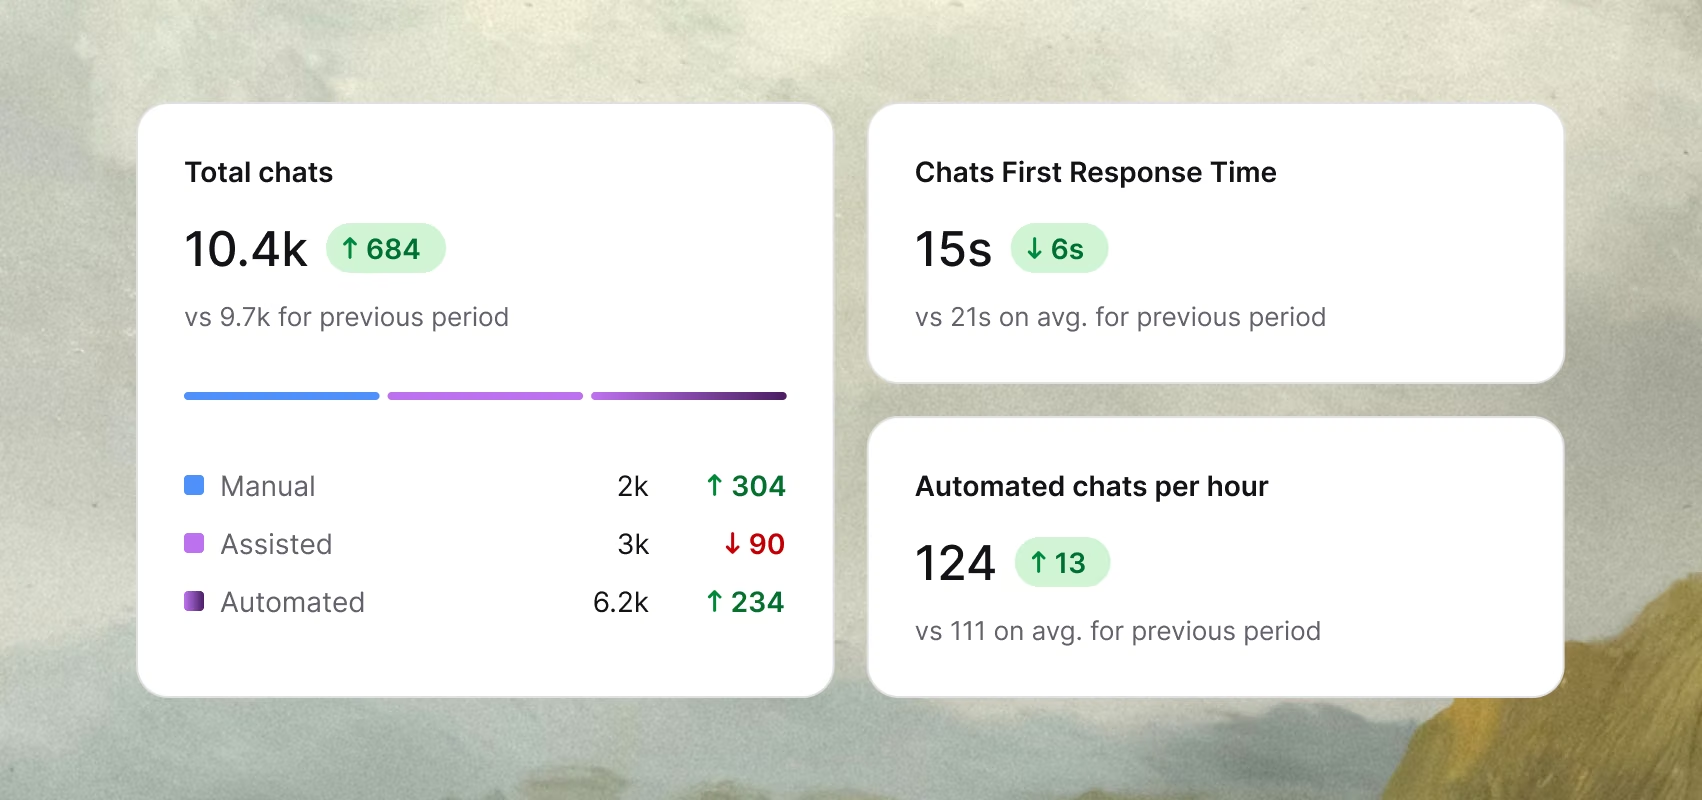
Live signals. Long-term trends
Chat volume, CSAT, and response time, tracked live and over weeks. See a dip the moment it happens, or a trend that's been building since Tuesday.
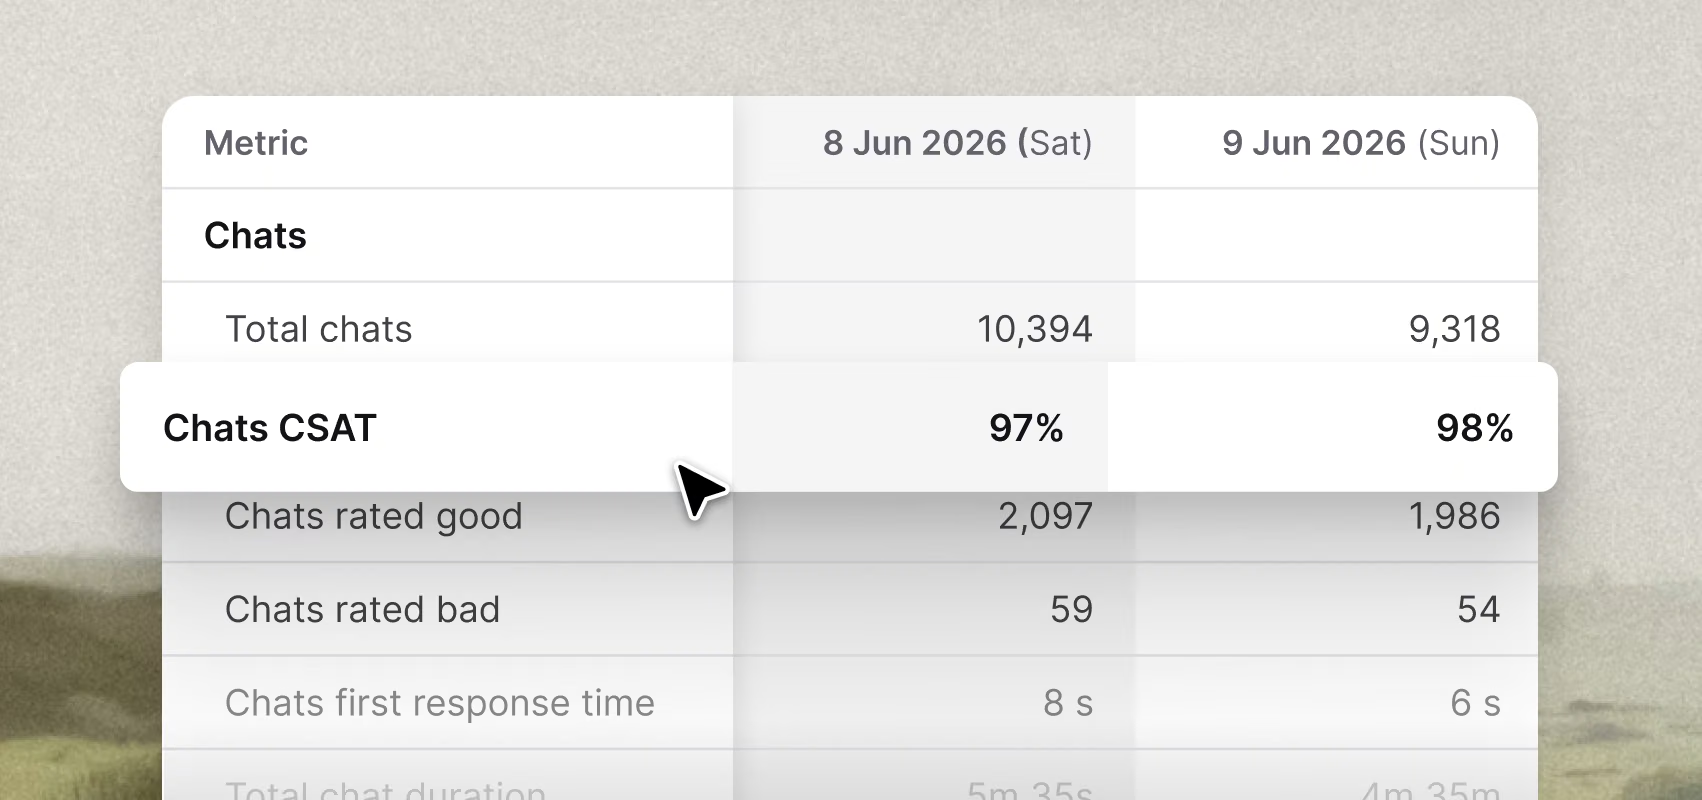
Reports that speak business
One click turns chats and tickets into a clear picture: what's working, where response times lag, and where revenue is slipping away.
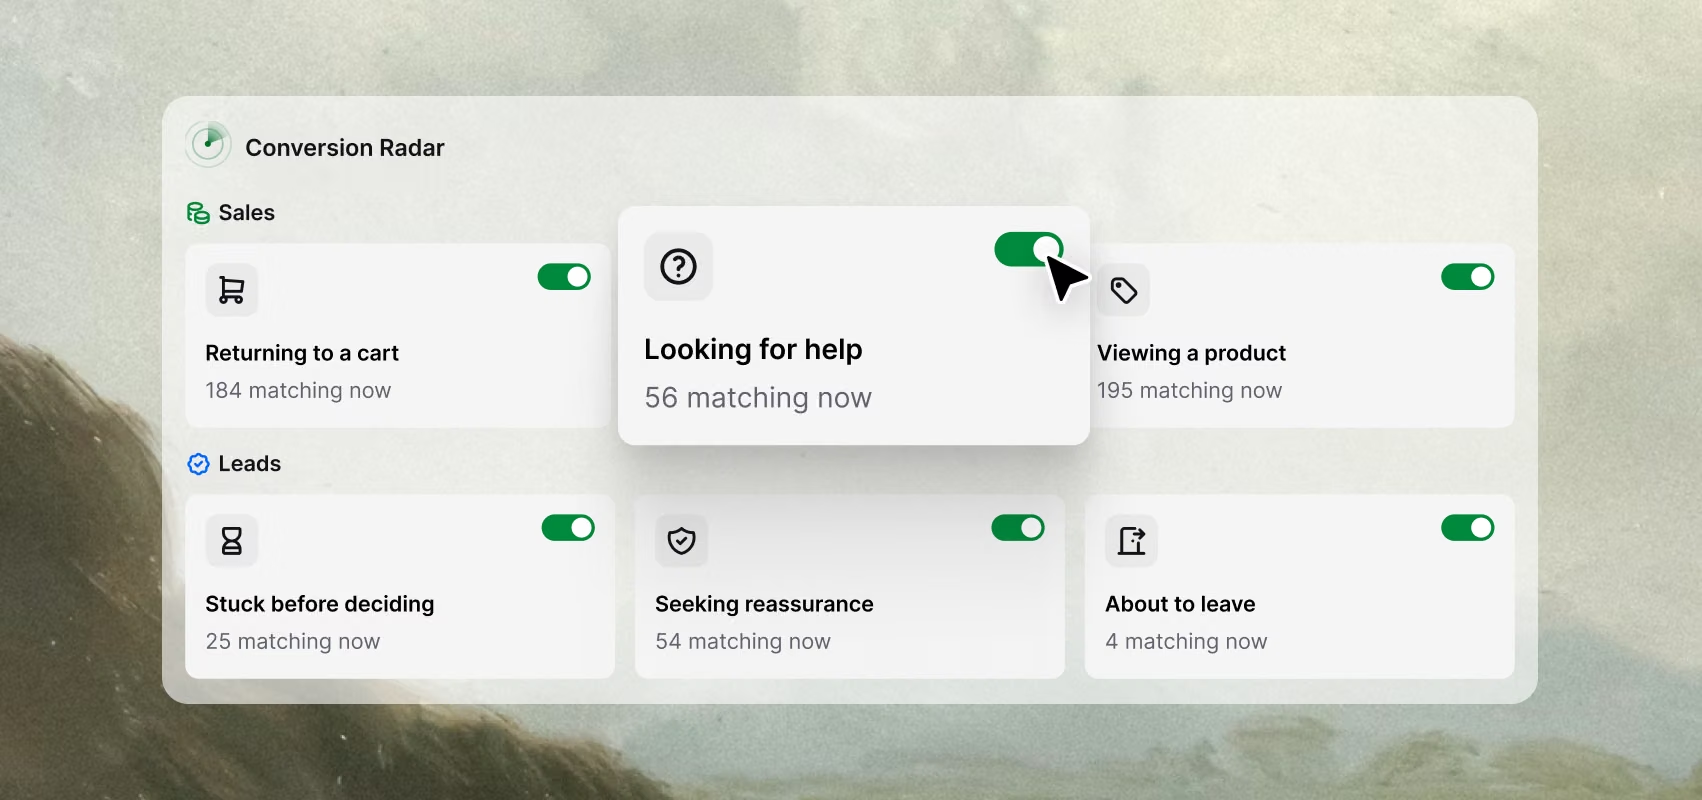
Buyers, spotted early
Every visitor sorted by intent, from casual browsing to comparing prices to closing in on checkout. Step in the moment it actually counts.
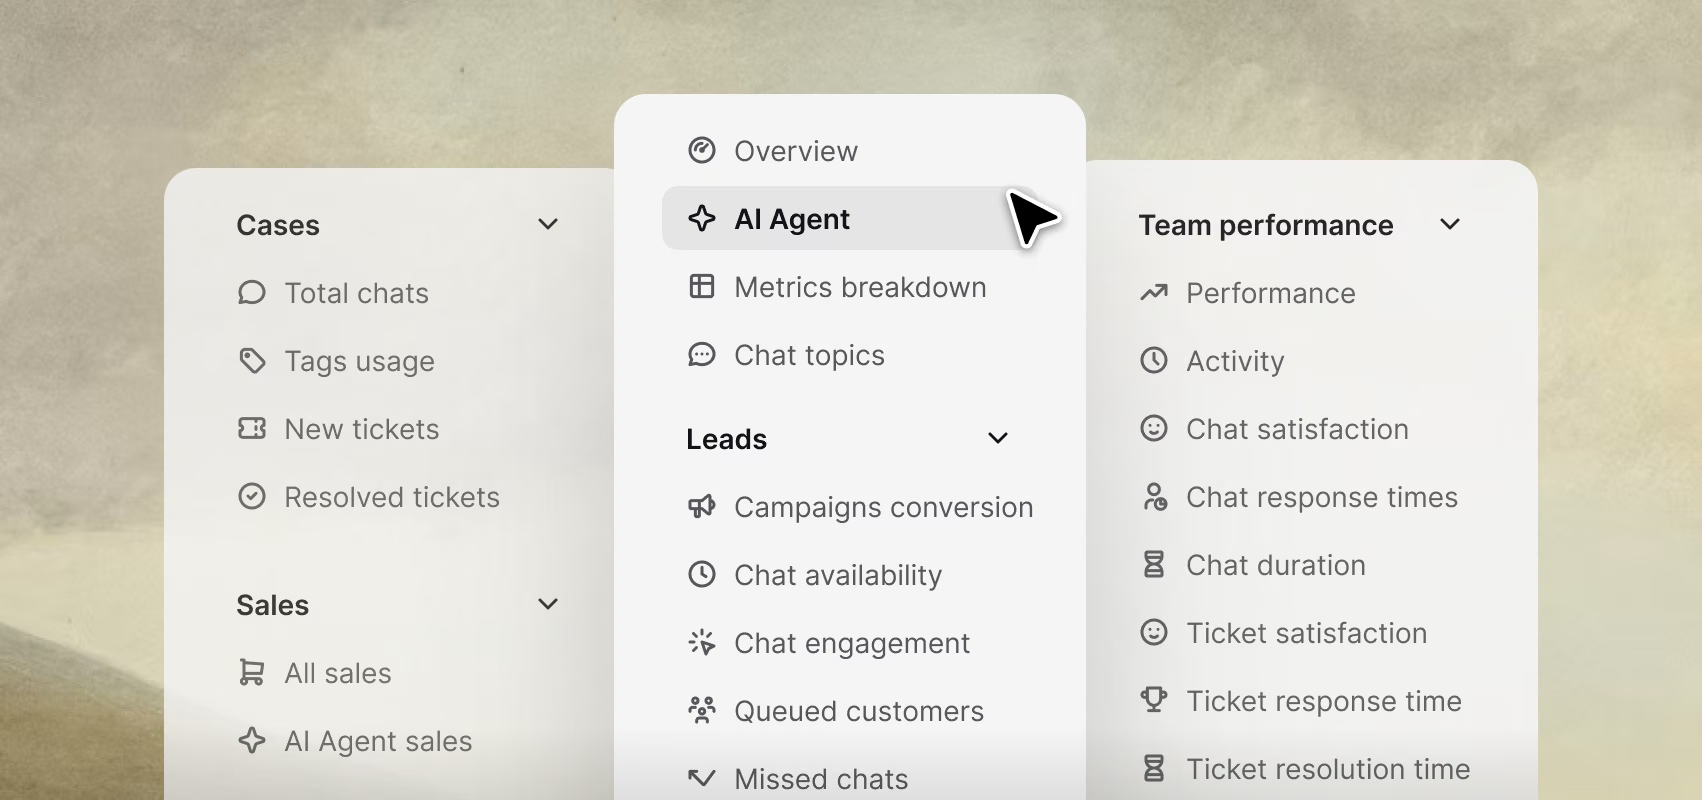
Built-in analytics, no extra tools
No separate dashboards, no third-party tools to configure and maintain. Everything ships ready to use, right inside the platform.
Start free for 14 days. Continue with transparent pricing.
Every feature your team needs, built to pay off.
AI Agent
AI AgentLive chat
Live chatHelp desk
Help deskInbox
InboxCopilot
CopilotTicketing system
Ticketing systemChat widget
Chat widgetCustomer list
Customer listKnowledge base
Knowledge baseService desk
Service deskMCP
MCPCustomer service management
Customer service management
AI Agent
AI Agent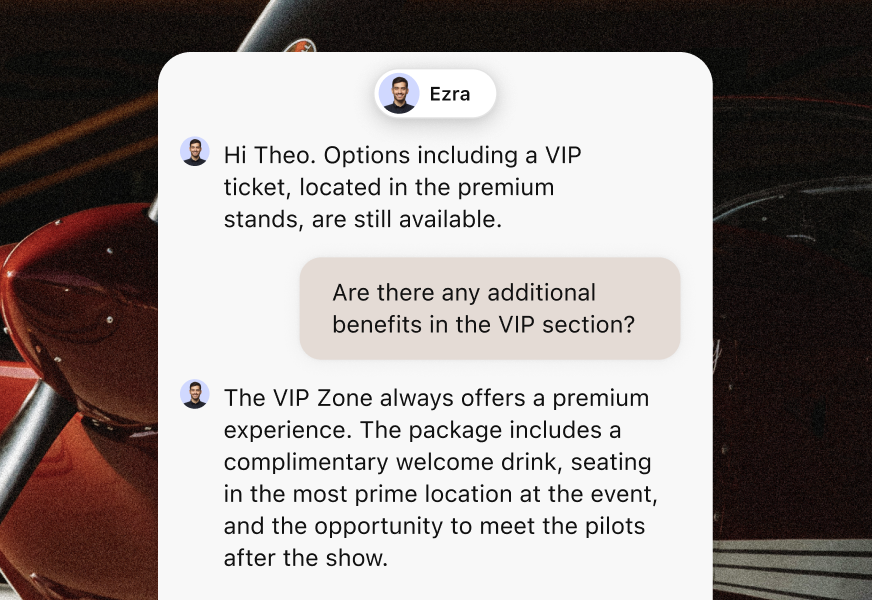
Live chat
Live chat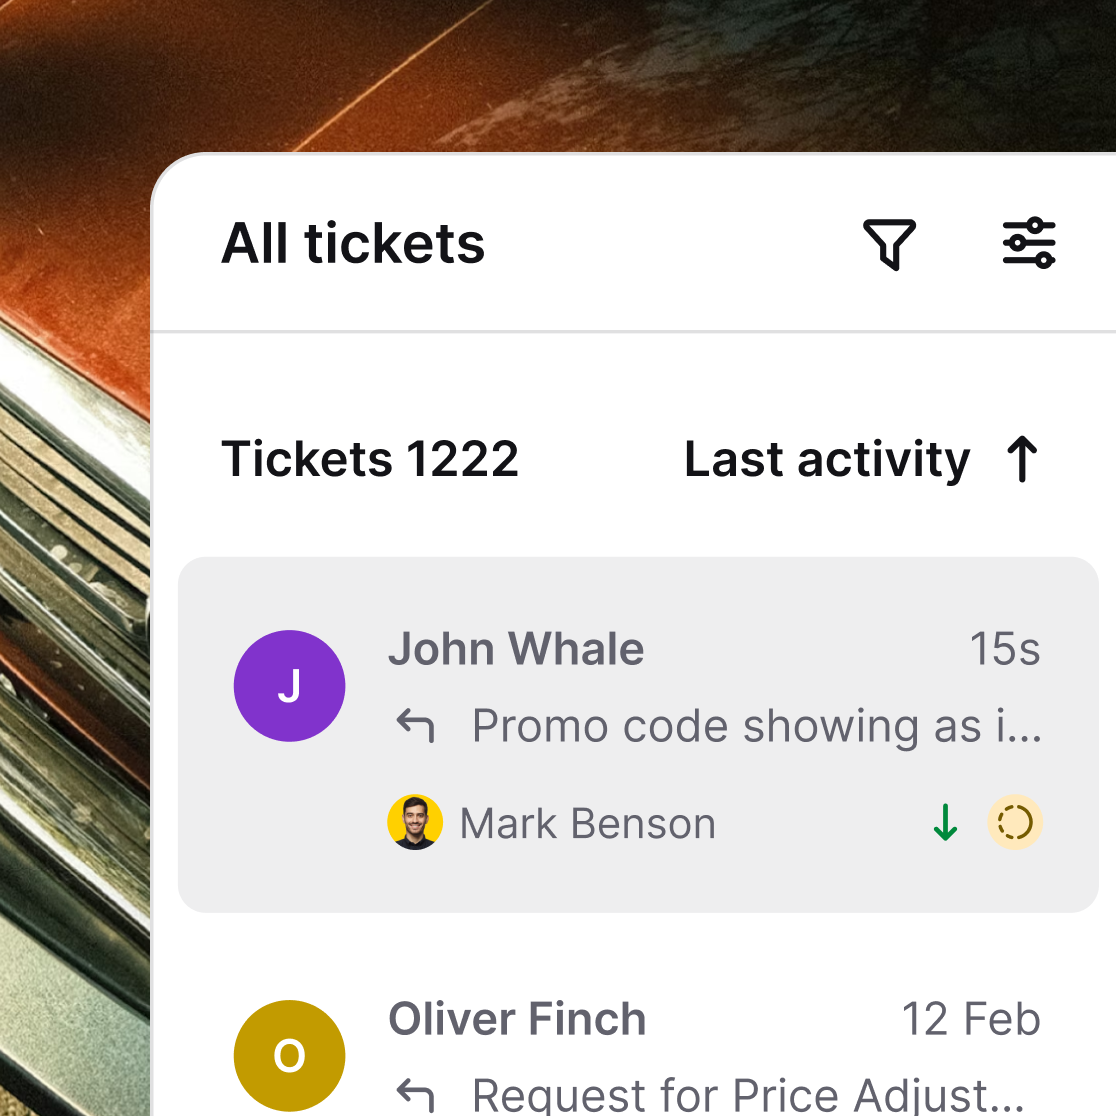
Help desk
Help desk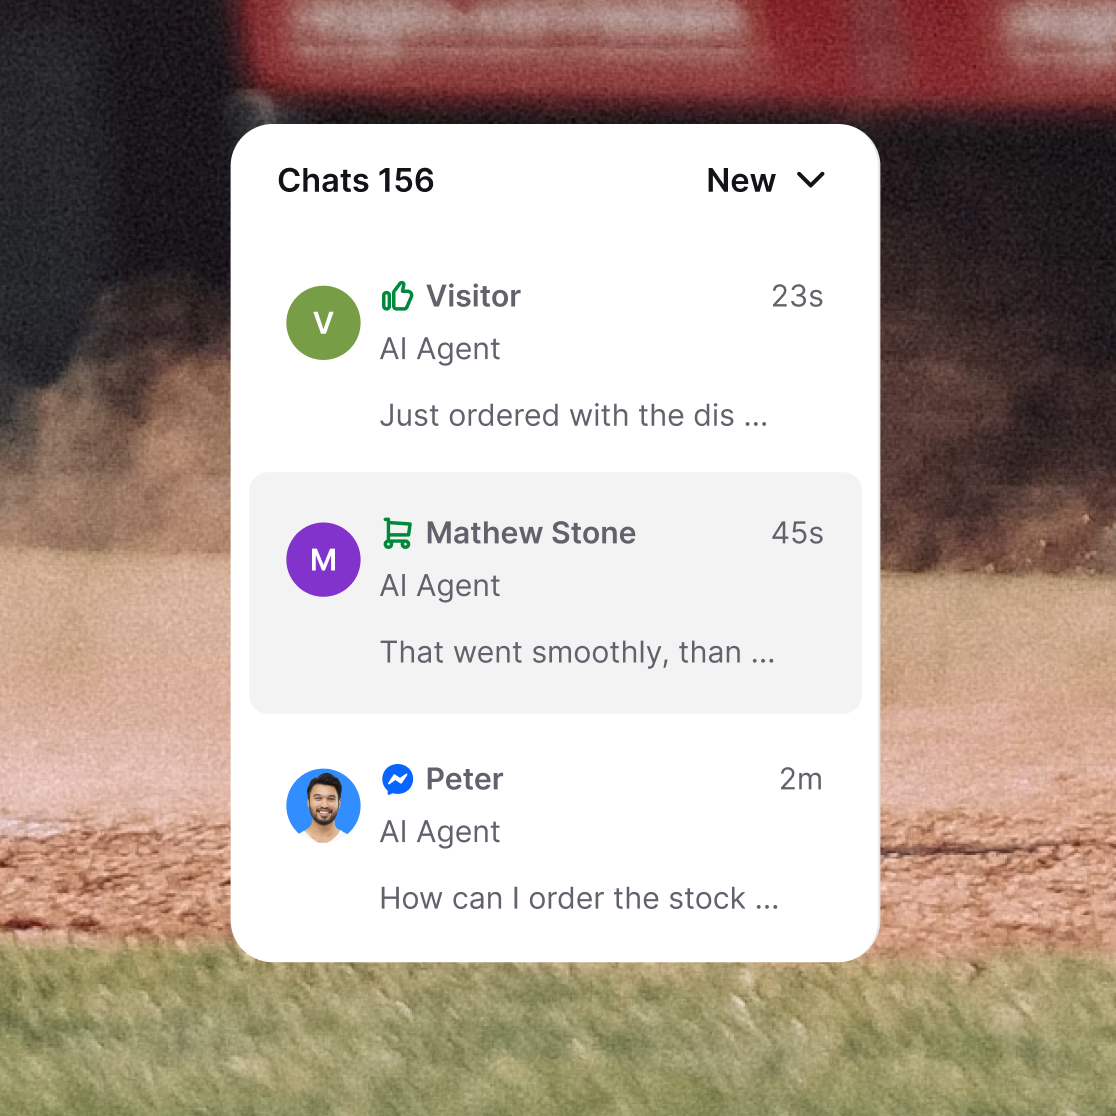
Inbox
Inbox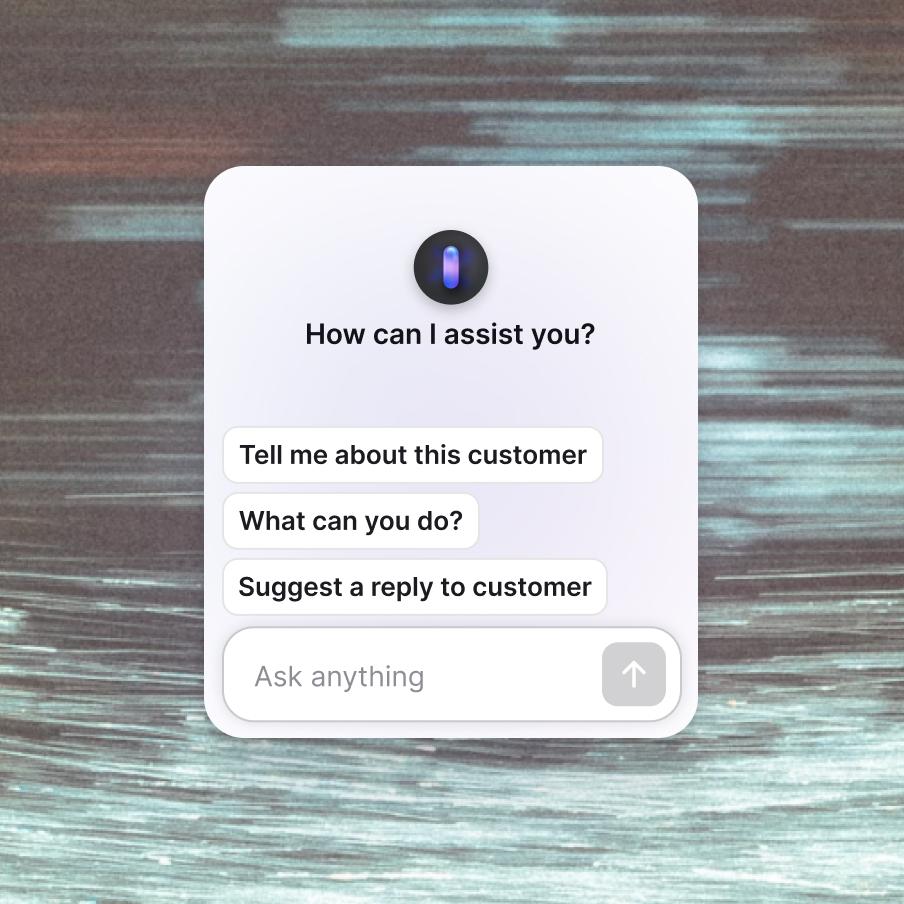
Copilot
Copilot
Ticketing system
Ticketing system
Chat widget
Chat widget
Customer list
Customer list
Knowledge base
Knowledge base
Service desk
Service desk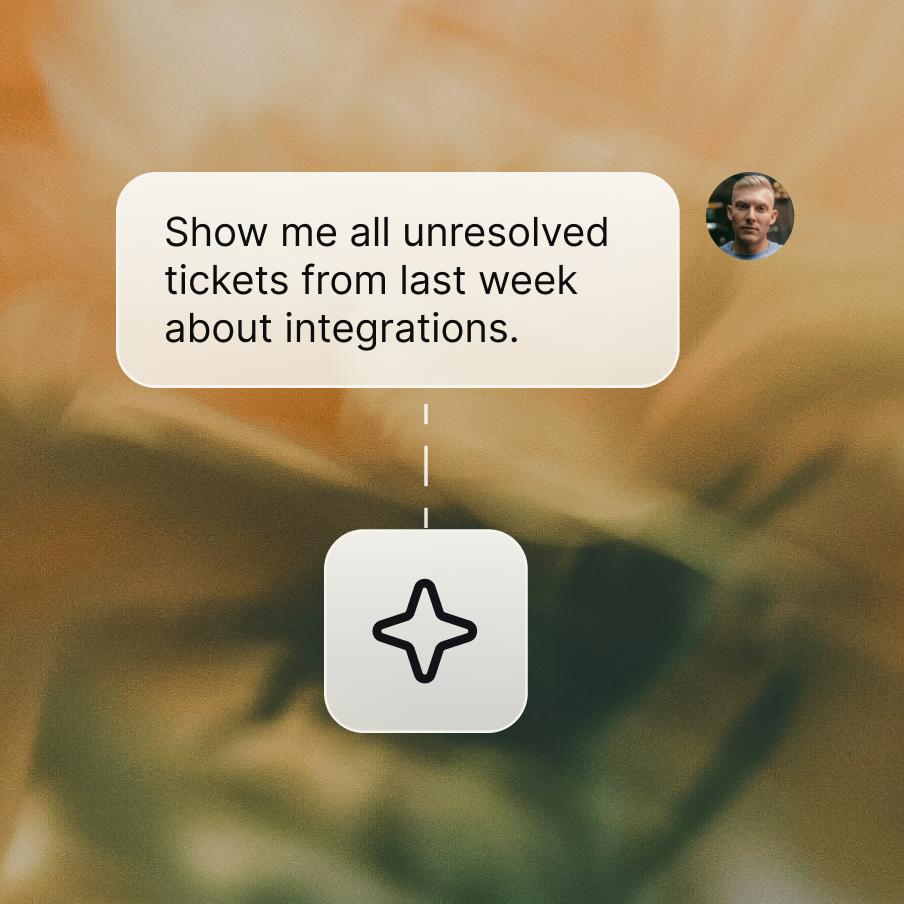
MCP
MCP
Customer service management
Customer service management
Enterprise-grade security & compliance



Sales hide across your support. Start counting them.
Frequently asked questions
What is customer analytics?
Customer analytics is the process of collecting, measuring, and analyzing customer behavior data to make better business decisions — understanding who your customers are, how they interact with you, where they get stuck, and what makes them stay or leave. The discipline covers everything from purchase patterns to support interactions to product usage. For support teams specifically, customer analytics tends to focus on the conversation layer: how customers reach out, how long it takes to resolve their issues, and what they're actually contacting you about.
What is customer service analytics?
Customer service analytics is the slice of customer analytics focused on the support function — measuring how your team handles conversations, how quickly they resolve issues, and how customers feel about the service they got. Sometimes called customer support analytics or customer service data analytics, it answers questions like "is our resolution time trending up or down this month?", "which agents need coaching?", and "what topics are driving the most tickets?"
Text covers this out of the box across four report categories: Leads (where chats are coming from, when you're missing them, and what's converting), Cases (chat and ticket volume, what topics are showing up, what's still open), Sales (revenue tracked back to conversations, including sales closed by AI Agent), and Team performance (agent activity, satisfaction scores, response and resolution times across chats and tickets). On top of that, dedicated views for AI agent performance, Metrics breakdown, and Chat topics, plus a unified Customers section that combines real-time visitor activity with full chat and ticket history and lightweight CRM-style profiles. Every chat, ticket, and rating feeds into reports managers can actually act on — no separate analytics stack required.
What customer service metrics should you track?
The customer service metrics that matter most fall into four categories:
- Speed — first response time, average response time, resolution time, queue wait time.
- Quality — customer satisfaction (CSAT), net promoter score (NPS), first contact resolution (FCR), customer effort score (CES).
- Volume — chat and ticket volume by channel, by topic, by time of day; chat-to-ticket conversion; automated resolution rate; backlog size.
- Team — agent utilization, chats per hour, average handle time, agent CSAT.
You don't need to track all of them. Start with one metric per category, get the team aligned on what "good" looks like, and add more as the operation matures. Tracking 30 KPIs that nobody acts on is worse than tracking 4 that drive real decisions.
What are the most important help desk metrics?
Help desk metrics — sometimes just called support metrics — are the operational signals that tell you whether your help desk is healthy. The most important ones:
- First response time — how fast customers hear back after reaching out, both on chat and ticket.
- Resolution time — how long it takes to close a ticket end-to-end.
- Handling time — how long agents actually spend working a ticket, broken down by status.
- Customer satisfaction (CSAT) — collected via post-chat and post-ticket surveys, separately for each channel.
- Ticket volume — new tickets coming in versus resolved tickets going out, so you can see whether the backlog is growing or shrinking.
- Automated resolution rate — the share of chats resolved without a human stepping in.
- Missed chats — chats your team didn't pick up, the clearest signal of capacity or coverage gaps.
In Text, all six are tracked automatically from chat and ticket data — no manual logging. Team performance covers response times, resolution time, handling time, and satisfaction (separately for chats and tickets). Cases covers ticket volume (New tickets, Resolved tickets) alongside Total chats. Leads covers Missed chats and related top-of-funnel signals like Queued customers and Chat availability. Everything surfaces inside AI Help Desk without exports or BI setup.
What are some customer service KPI examples?
Concrete customer service KPI examples teams actually use, all available in Text:
- First Response Time (FRT) — target under 1 minute for chat, under 1 hour for ticket. Tracked separately under Team performance → Chat response times and Ticket response time.
- Resolution Time — how long tickets take to close end-to-end; varies wildly by industry, so track the trend more than the absolute number. Team performance → Ticket resolution time.
- Handling Time — actual agent time on a ticket, broken down by status. Useful for spotting tickets that are open but idle. Team performance → Ticket handling time.
- CSAT — percentage of "good" ratings out of all ratings collected. Text splits this into Chat satisfaction and Ticket satisfaction, so you can see where the experience is dropping off.
- Chat Duration — how long the average chat takes. Pair with CSAT to spot the "fast but unhappy" combination. Team performance → Chat duration.
- Missed Chats — chats your team didn't pick up. The clearest signal of capacity or coverage gaps. Leads → Missed chats.
- AI Resolution Rate — for teams running AI Agent, the percentage of chats resolved without human handoff. AI agent report section.
- AI Agent Sales — revenue closed by AI Agent without a human in the loop. Sales → AI agent sales.
- Ticket Volume — new tickets coming in versus resolved tickets going out, so you can see whether the backlog is growing or shrinking. Cases → New tickets, Resolved tickets.
These KPI metrics for customer service are most useful when paired with a target and a review cadence — "track and review weekly" beats "track and ignore."
What is customer analytics software?
Customer analytics software is the tool you use to measure and analyze customer behavior — collecting data from your channels, organizing it into dashboards, and surfacing trends. There are two broad categories:
- Product analytics platforms (Mixpanel, Amplitude, PostHog) — built for measuring how users interact with a product or website. Strong for funnel analysis and event tracking.
- Customer analytics platforms for support (built into help desk tools like Text) — built for measuring conversations, tickets, and team performance. Strong for operational decisions about your support function.
Customer service analytics software lives inside the platform where the conversations actually happen — because the data already exists there, and you don't want to set up an ETL pipeline just to know your average response time.
How is customer service analytics different from product analytics?
They measure different things and answer different questions:
- Product analytics measures behavior in your product — clicks, signups, conversions, feature adoption. Tools like Mixpanel and Amplitude are built for this.
- Customer service analytics measures conversations with your team — response times, resolution rates, CSAT, ticket topics, agent performance.
Both matter, and ideally they connect — knowing that customers who contact support twice in their first week have 3x churn risk needs both data sets. But they're built for different jobs, used by different teams, and shouldn't be confused. Text's customer service analytics covers the conversation layer; for product behavior analytics, you'll want a dedicated product analytics tool alongside.
What is a customer service metrics dashboard?
A customer service metrics dashboard is a real-time view of your team's key performance indicators in one place — first response time, resolution time, CSAT, ticket volume, queue depth, agent load. The point isn't to look pretty; it's to make problems visible fast.
Text covers this in two layers:
- Real-time customers view — managers see seven pre-defined segments (chatting, queued, waiting for reply, supervised, browsing, invited, all customers) updating continuously.
- Metrics breakdown report — brings all key metrics into one place with daily, weekly, and monthly views, downloadable as CSV for further analysis.
Combined with the four report categories — Leads, Cases, Sales, and Team performance — plus standalone views for AI agent and Chat topics, that gives managers both the "what's happening right now" and the "how are we doing this week" views without exporting data or building reports from scratch.
What customer service KPIs should you report on weekly?
For weekly customer service reporting, focus on a small set of metrics that show whether the operation is healthy and improving. Text's Metrics breakdown report groups them into three sections:
- Chats — Total chats, Chats CSAT (split into rated good vs rated bad), Missed chats, Chats first response time, and chat duration broken down by Avg. manual chat duration vs Avg. automated chat duration. The manual/automated split is the one that shows how much AI Agent is actually offloading from your human team.
- Engage — Campaigns displayed, Chats from campaigns, and Campaigns conversion. Worth a weekly glance if you're running proactive engagement — it's where you see whether the campaigns are pulling their weight.
- Tickets — New tickets vs Tickets solved vs Tickets closed (the in/out balance that tells you if the queue is growing), Tickets CSAT split into good/neutral/bad, Tickets first response time, and Tickets resolution time.
Anything more granular usually lives outside Metrics breakdown: per-agent outliers in Team performance, AI Agent resolution rate and Transferred chats in the AI agent report, ticket handling time by status in Team performance → Ticket handling time. For weekly reviews, the Metrics breakdown view is usually enough — and for teams that want to push reporting into a BI tool or warehouse, the MCP server gives AI assistants and external tools structured access to the same underlying data.
How does Text support customer service analytics?
Text covers customer service analytics across three layers:
- Real-time monitoring. The Customers section gives managers a live view of every visitor on the site, broken down into seven activity segments (chatting, queued, waiting for reply, supervised, browsing, invited, all customers). Filters narrow by location, device, contact details, or visit history. Useful for catching queue spikes before they become CSAT problems.
- Full reporting suite. Built-in report sections cover every part of the operation:
- Leads — Campaign conversions, Chat availability, Chat engagement, Queued customers, Missed chats.
- Cases — Total chats, Tags usage, New tickets, Resolved tickets.
- Sales — All sales, AI agent sales.
- Team performance — Performance, Activity, Chat satisfaction, Chat response times, Chat duration, Ticket satisfaction, Ticket response time, Ticket resolution time, Ticket handling time.
- AI agent — dedicated view for AI Agent's chat volume, satisfaction, and resolution metrics.
- Chat topics — what's actually being talked about, filtered by keyword.
- The Metrics breakdown report rolls the most-used metrics into daily/weekly/monthly views with CSV export.
- Direct data access for AI tools and BI stacks. Connect Claude or ChatGPT to your Text account through the MCP server and pull raw conversation data into your AI assistant — list tickets, fetch transcripts, search chats and tags — so you can ask about specific cases ("show me the tickets tagged 'refund' from last week") instead of digging through the UI. The current MCP scope is the raw data layer (tickets, chats, transcripts, tags), not aggregated reports — for trend dashboards and roll-ups, use the report sections above. Workflows keeps an audit trail of what your automations actually ran, useful when something behaves unexpectedly.
For teams that want to combine support data with product or marketing data in a dedicated BI stack, CSV exports from Metrics breakdown plus MCP access to raw conversation data make the data portable. For most support operations, the first two layers already cover the analytics decisions you actually need to make day to day.