

Your team's real workload is chats and tickets added together.
The Total cases report gives you that number. One toggle switches between total cases, chats on their own, and tickets on their own.
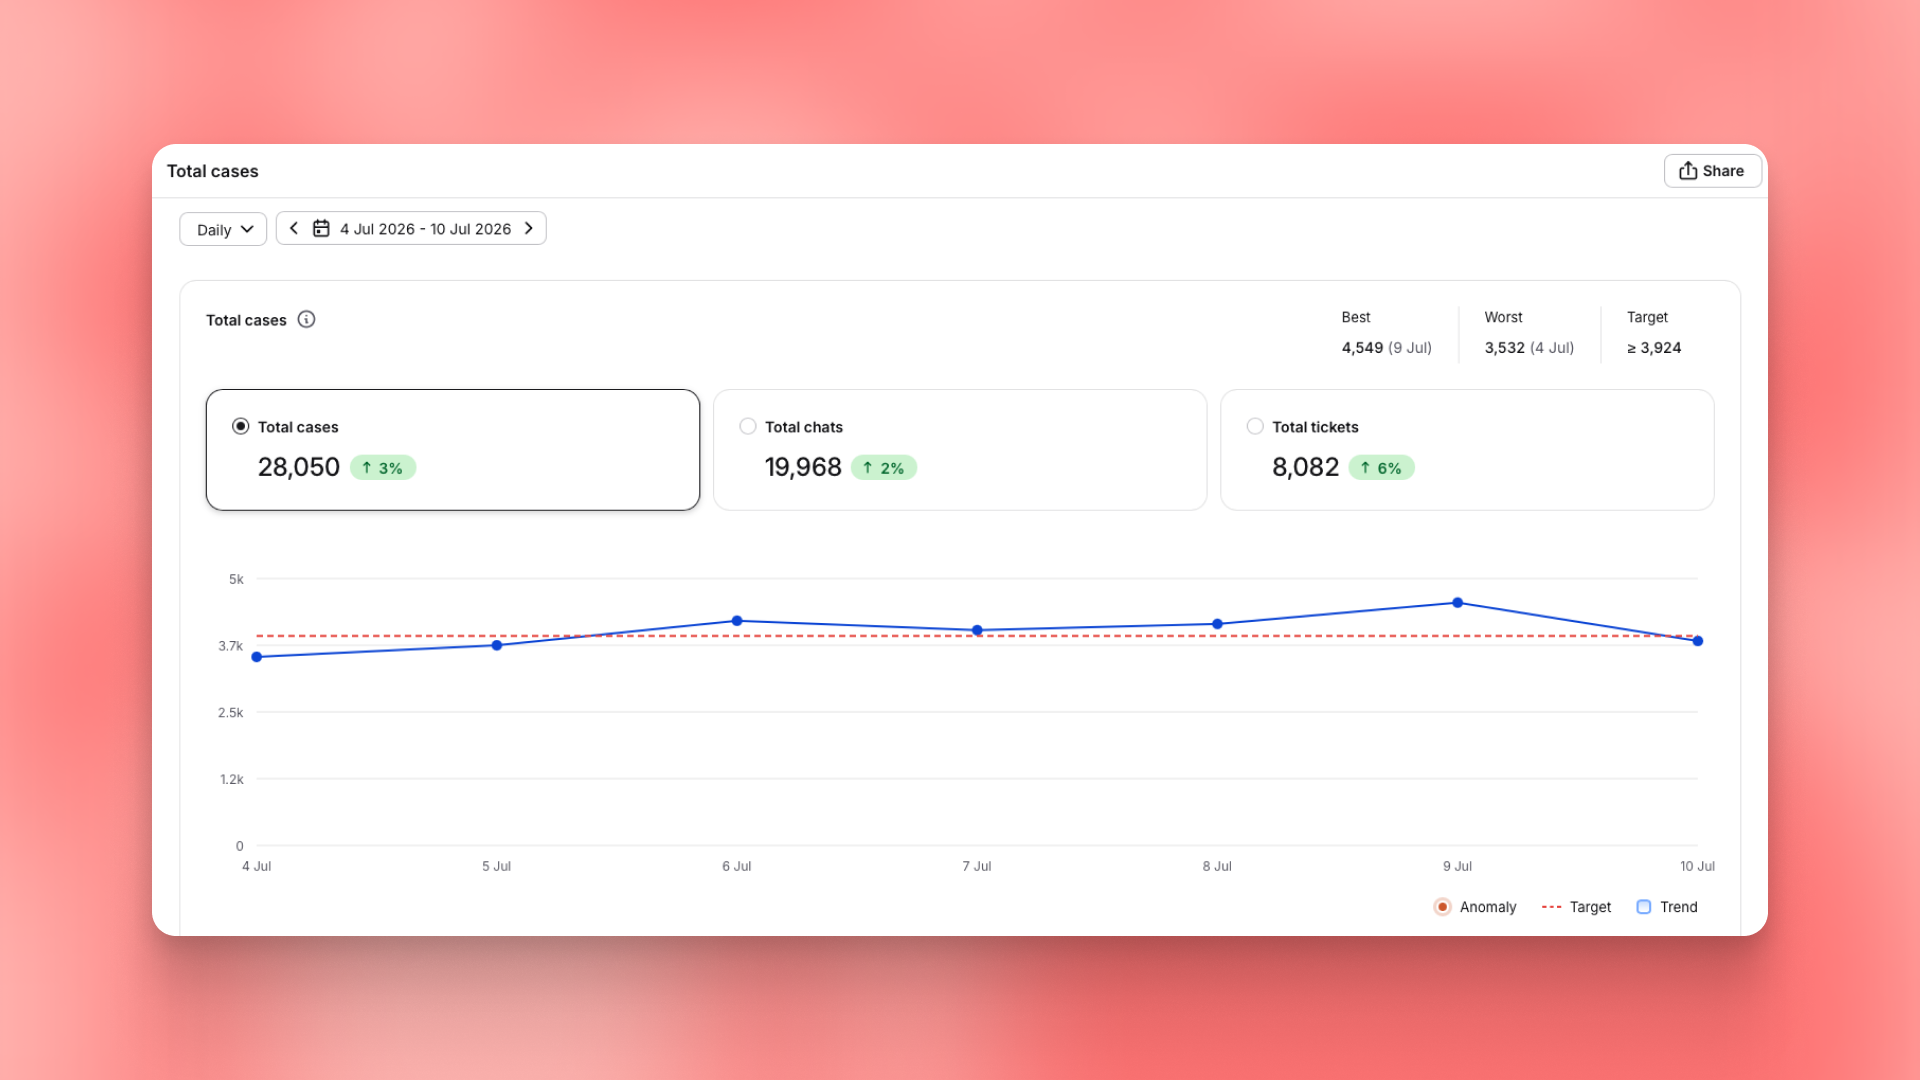
What the report shows
Each view marks your best and worst day in the range and shows which way the trend is heading. Unusual spikes and drops are flagged for you.
Set a target and the report draws it across the chart. You can see at a glance whether the week cleared it.
Why one number beats two
Staffing runs on the total. A single figure tells you whether Monday is heavier than Thursday, and whether this month is busier than last.
Chats and tickets both take an agent's attention, whatever the label on them. Counting them together is closer to how the work actually feels.
Available now
Live now in Text App, at Reports, then Total cases.
Get a summary with